

Agent-based workspaces are available on LangSmith Cloud. They are not available on self-hosted LangSmith. To check whether your workspace is agent-based, look at the control at the top left. In an agent-based workspace, it is a workspace switcher that names your workspace. In a project-based workspace, it shows the LangSmith logo.
Switch between agents
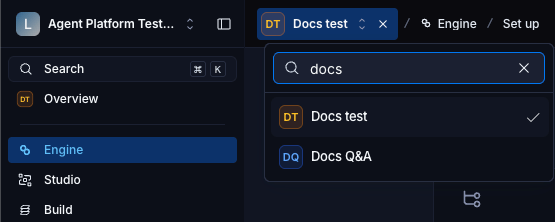
The agent switcher sits at the left of the top bar, after the workspace switcher and the panel collapse toggle. It reads either All agents or the name of the agent you are in. In a section other than the Overview, a breadcrumb follows it and names that section.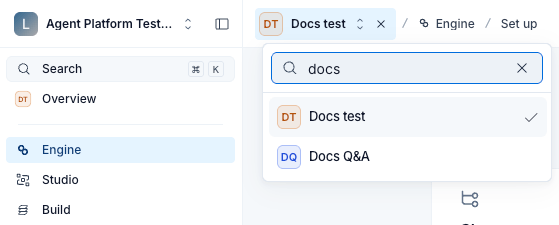
/o/<workspaceId>/a/<agentIdentifier>/.... The workspace slot takes a UUID, and the agent slot takes the agent’s identifier. A hyphen in the agent slot means all agents, so /a/- is the All agents view and /a/<agentIdentifier> is a single agent. Either state can be set from the address bar, which is how to link directly to one of the two views.
All agents and single-agent views
The switcher moves between two views:- All agents: The agent list, with one card for each agent in the workspace. In an empty workspace it shows a get-started screen instead, which describes the options in the New Agent panel and opens that panel from a single Get started button.
- A single agent: That agent’s Overview.
- Badge counts: Hidden on the agent list, except on Deployments. When you select an agent, the counts appear and cover only that agent.
- Section availability: Some sections ask you to pick an agent first. See Sections that require an agent.
Sections that require an agent
Most sections work with All agents selected, including the agent list, which lists every agent in the workspace, and Deployments, which lists every deployment in the workspace. Engine, Studio, Build, Tracing, and Monitoring need you to select an agent. If you open these sections with All agents selected, what you see depends on whether your workspace has any agents yet. If your workspace has agents, the section shows a searchable list of agents to pick from, headed Pick an agent to view. On Build, the list sits under “Configure an existing agent or build a new one.” instead. The top bar stays in place, so you can also pick from the switcher. Below the list, Studio shows Connect Agent Server and Build shows + New agent. Tracing also shows + New agent to users who can create projects. Build lists only agents built in the UI. The other sections list every agent in the workspace. With no agents in the workspace, Engine, Studio, Tracing, and Monitoring show the list empty, reading No agents available. Build shows the same empty list whenever the workspace has no agents built in the UI, even if it has other agents, and its + New agent button still starts a new agent. Deployments shows its own page, which offers ways to create a first deployment when the workspace has none. After you pick an agent, LangSmith keeps it selected as you move between these sections. To see the agent list for All agents, hover over the selected agent’s name in the switcher and select the X that appears beside it.Open Settings
Settings opens in its own layout: the agent switcher is gone, the navigation splits into Organizations and Workspace sections, and a Back to LangSmith link returns to the agent views.Read the agent Overview
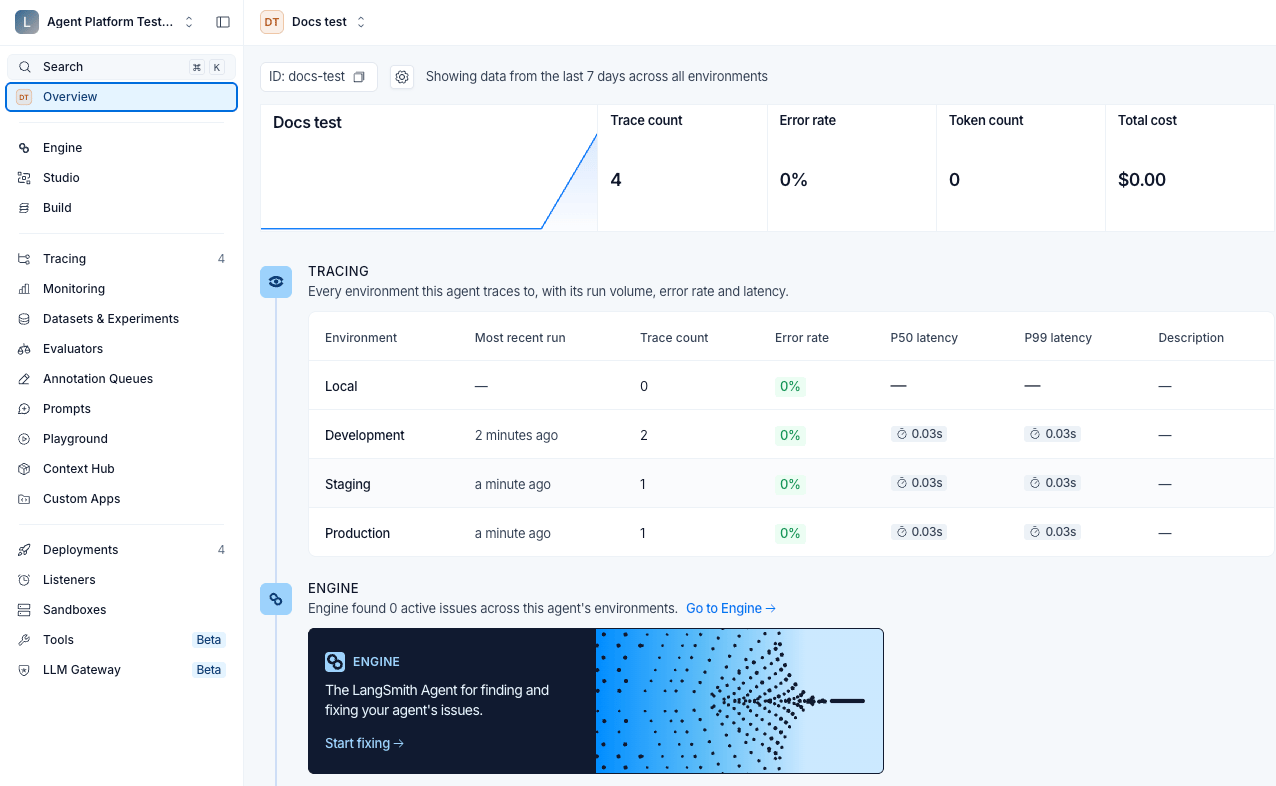
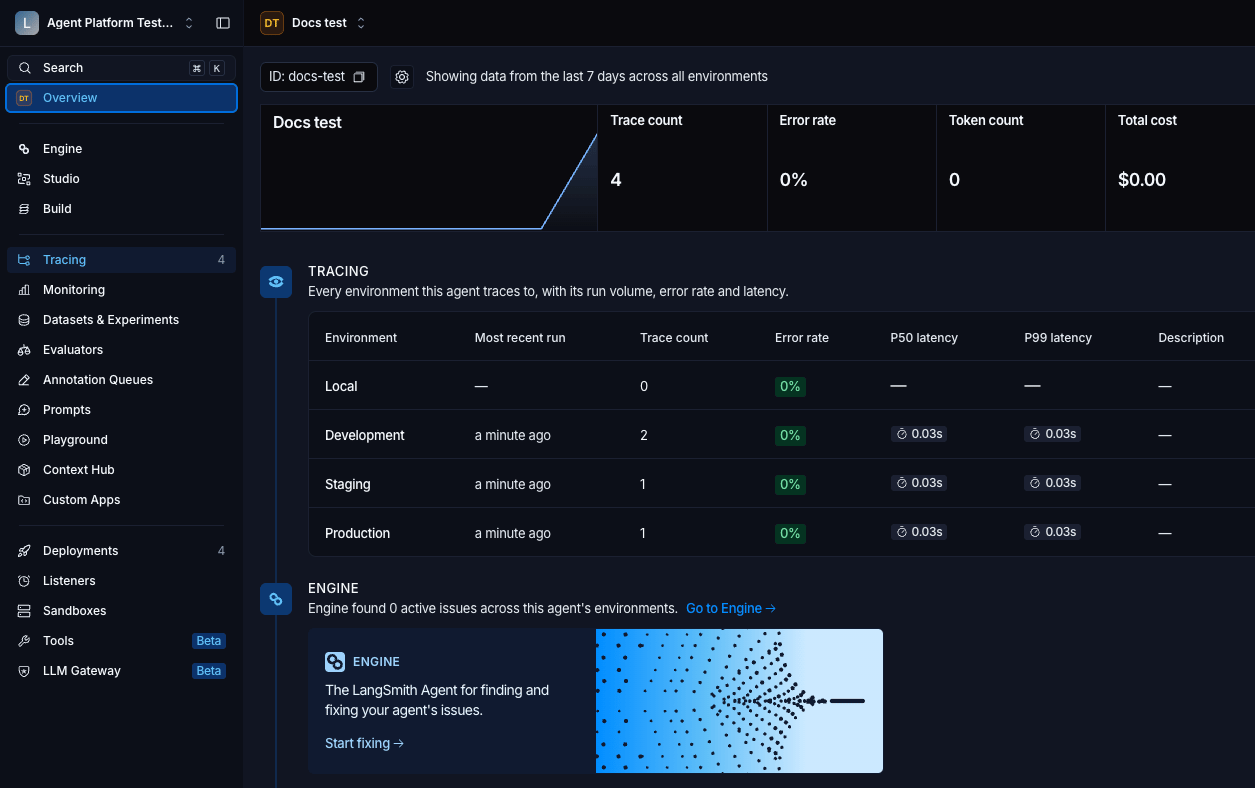
When you select an agent, LangSmith opens its Overview. The switcher shows the agent’s display name. A field labeled ID, with a copy button beside it, holds the identifier, which is also the value the address bar carries. The ID field shortens a long identifier in the middle. Use the copy button beside ID when you need the value for tracing. Agent addressing takes the identifier, not the display name. For which value is which, see Identifiers and display names. Below the ID field, the Overview shows the following, in order:- Metrics: Trace count, error rate, token count, and total cost, each covering a fixed period of the last 7 days across all environments. A sparkline of traces over time leads the row.
- Tracing: One row per environment the agent has, including environments with no traces, with the most recent run, trace count, error rate, P50 latency, P99 latency, and description.
- Engine: The number of active issues Engine has found across this agent’s environments, and a Go to Engine link.
- Evaluate your agent: Describes evaluation on datasets and on live production traces, with a Go to evaluators link to evaluators.
- Monitor your agent: Describes how to monitor an agent with dashboards, alerts, and feedback, from individual traces to production-wide metrics, with a Go to dashboards link to dashboards.
- Deployments: The deployments bound to this agent by the steps in Deploy to an agent environment. Each row links to that deployment. With none, the section describes what a deployment is and shows no rows. For which agents show this section, see Compare the four routes.
See also
Connect these docs to your agent of choice via MCP for real-time answers.