

Share a trace
To share a trace publicly:- Open any trace in the UI.
- Click the Share button in the more menu at the top of the Details view.
- In the dialog that appears, copy the public link.
- Open the shared trace, click Public in the toolbar at the top of the Details view, then click Unshare in the dialog.
- Go to Settings → Shared URLs to view all publicly shared traces in the selected workspace. Click Unshare next to the trace you want to unshare.
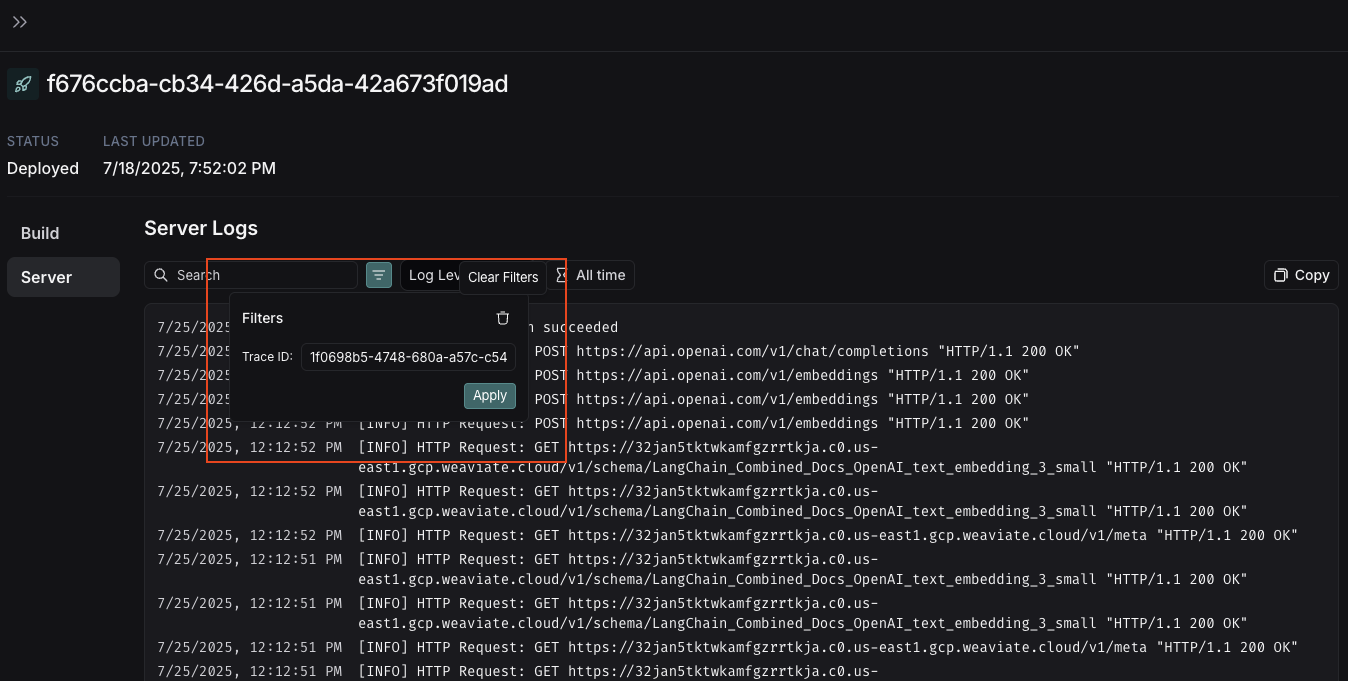
View server logs
Viewing server logs for a trace only works with the Cloud SaaS and fully self-hosted deployment options.
- Agent Server’s own operational logs: Internal server operations, API calls, and system events
- User application logs: Logs written in your graph with:
-
Python: Use the
loggingorstructloglibraries. -
JavaScript: Use the re-exported Winston logger from
@langchain/langgraph-sdk/logging:
-
Python: Use the
Delete a trace
If you need to remove traces from LangSmith before their expiration date, you can delete an entire project or delete specific traces.Delete an entire project
- In the LangSmith UI, select the Delete option on the project’s overflow menu.
- With the
delete_tracer_sessionsAPI endpoint. - With the
delete_project()(Python) ordeleteProject()(JS/TS) in the LangSmith SDK.
Delete specific traces:
Use thedelete_runs API endpoint to delete runs by trace IDs or metadata key-value pairs. The request body accepts:
session_id: scope deletion to a specific project.trace_ids: list of trace IDs to delete.metadata: delete all runs matching the given metadata key-value pairs.
Connect these docs to Claude, VSCode, and more via MCP for real-time answers.