

- Analyze a single experiment: View and interpret experiment results, customize columns, filter data, and compare runs.
- Set a baseline in the Experiments tab view: Set a baseline for a dataset that you want to outperform.
- Filter and group by models, prompts, and tools in the Experiments tab view: Use Models, Prompts, and Tools columns to filter and group experiments in the Experiments tab view.
- Download experiment results as a CSV: Export your experiment data for external analysis and sharing.
- Rename an experiment: Update experiment names in both the Playground and experiment view.
Analyze a single experiment
After running an experiment, you can use LangSmith’s experiment view to analyze the results and draw insights about your experiment’s performance.Open the experiment view
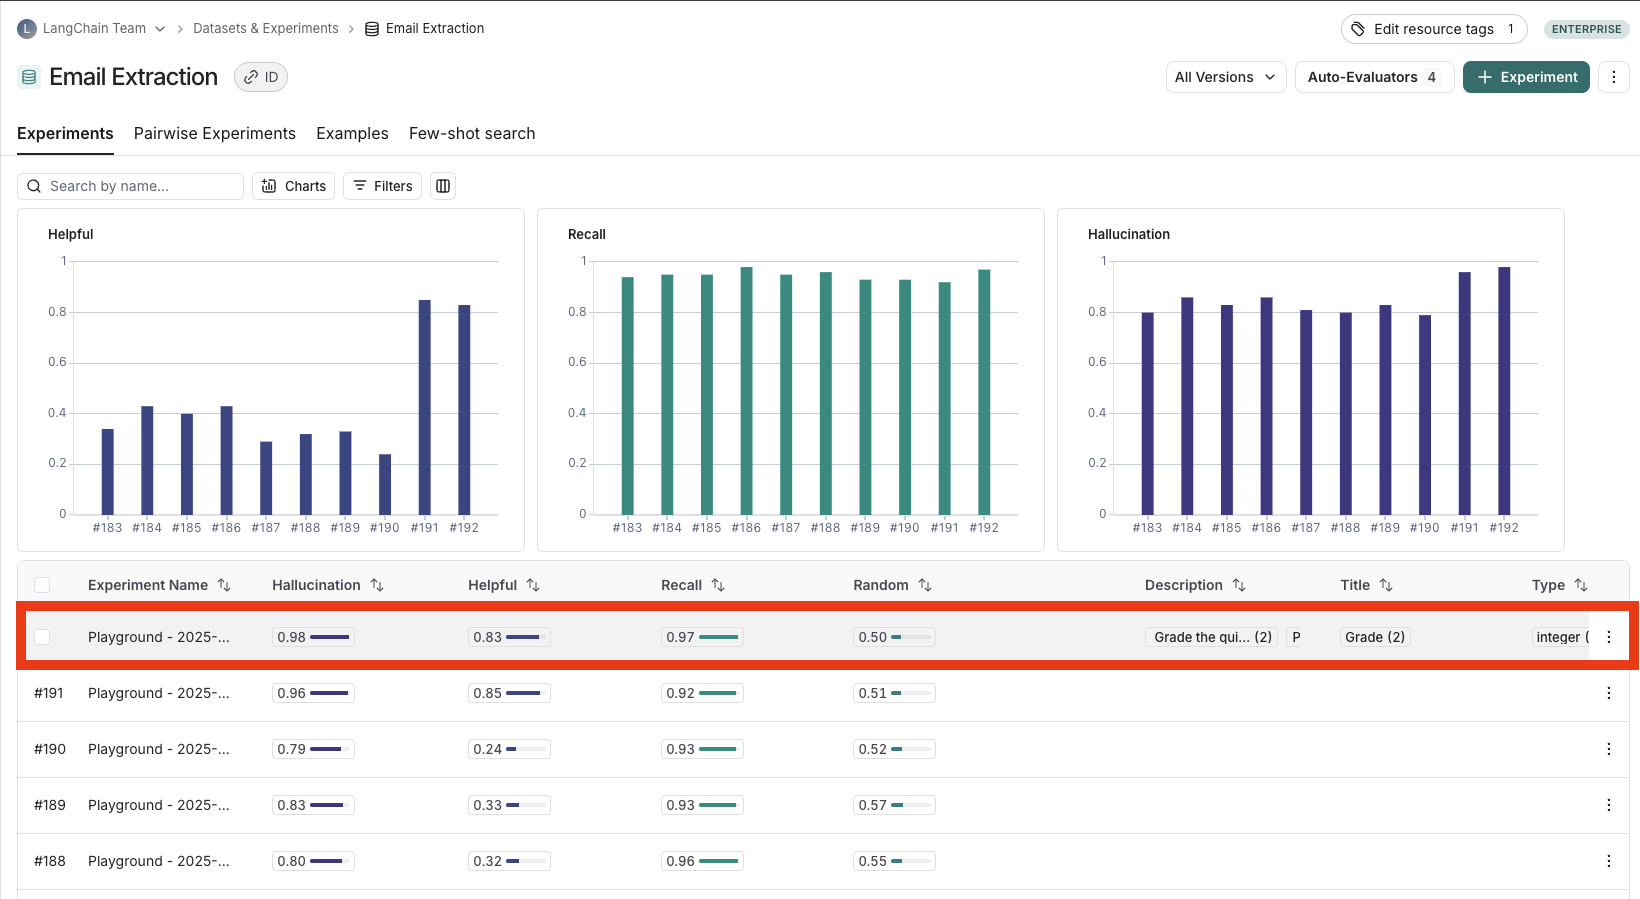
To open the experiment view,- Select the relevant dataset from the Dataset & Experiments page which opens the Experiments tab view.
- Click the row of the experiment you want to view.
View experiment results
Customize columns
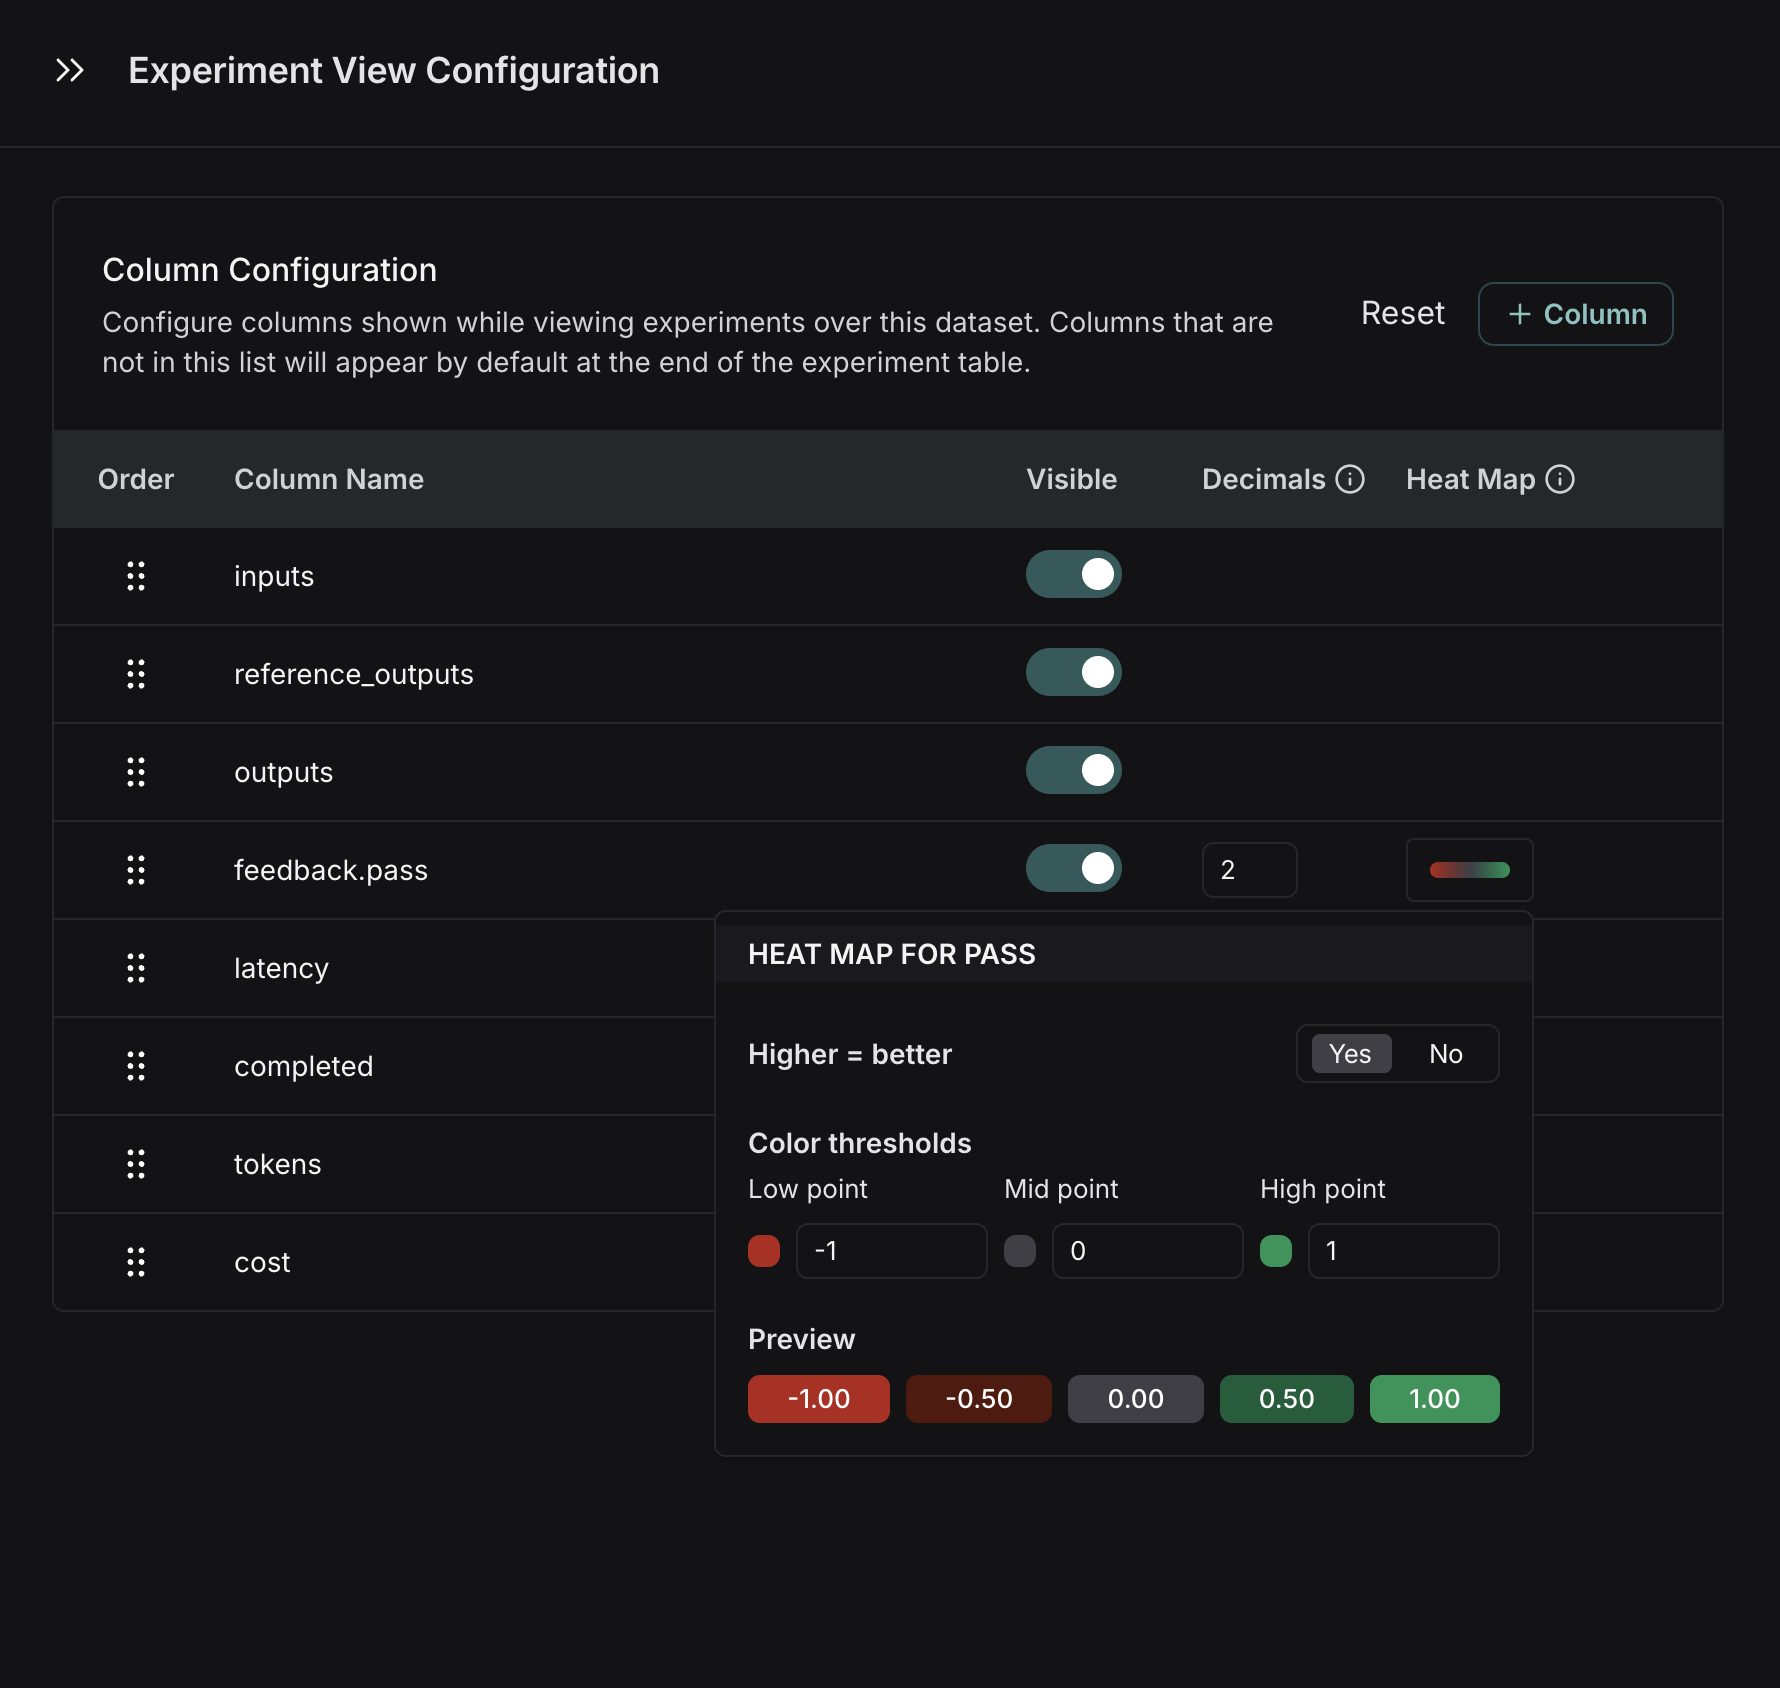
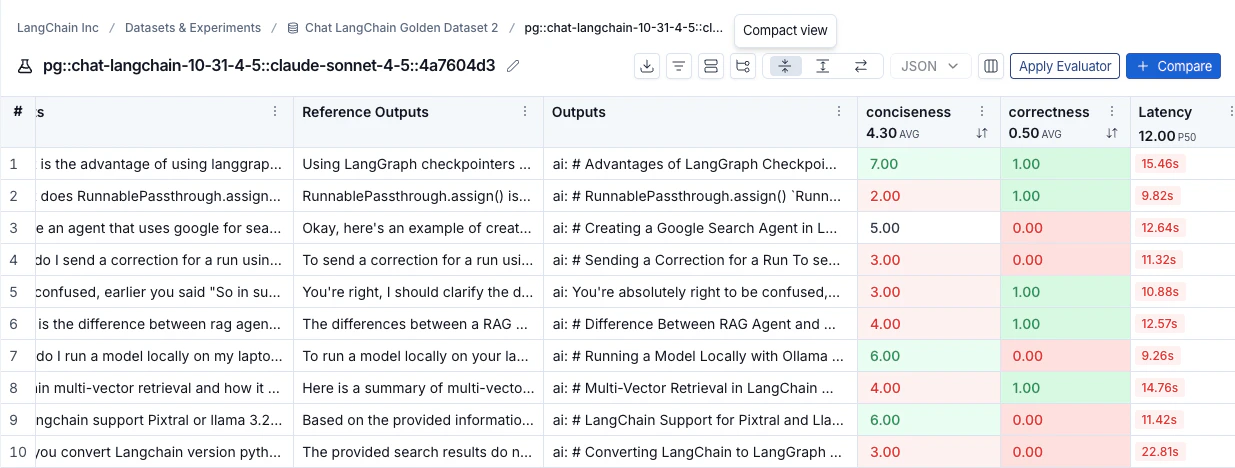
By default, the experiment view shows the input, output, and reference output for each example in the dataset, feedback scores from evaluations and experiment metrics like cost, token counts, latency and status. You can customize the columns clicking the Columns icon at the top right of the view to make it easier to interpret experiment results:- Break out fields from inputs, outputs, and reference outputs into their own columns. This is especially helpful if you have long inputs/outputs/reference outputs and want to surface important fields.
- Hide and reorder columns to create focused views for analysis.
- Control decimal precision on feedback scores. By default, LangSmith surfaces numerical feedback scores with a decimal precision of 2, but you can customize this setting to be up to 6 decimals.
- Set the Heat Map threshold to high, middle, and low for numeric feedback scores in your experiment, which affects the threshold at which score chips render as red or green:
Sort and filter
To sort rows by a feedback score, click the Sort by icon in the column header.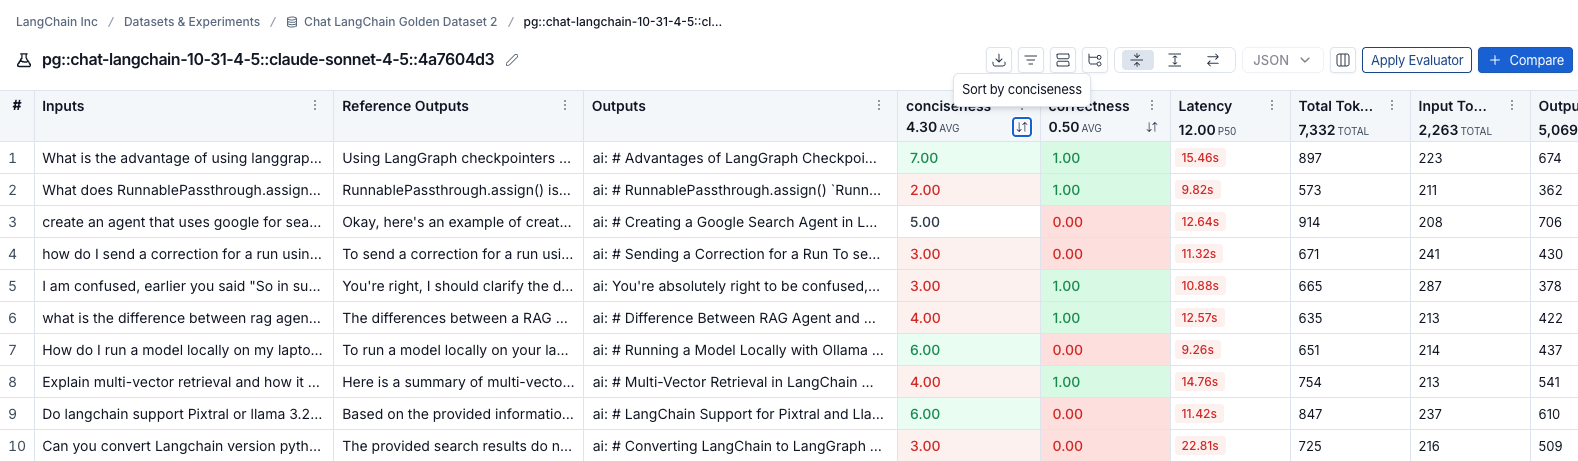
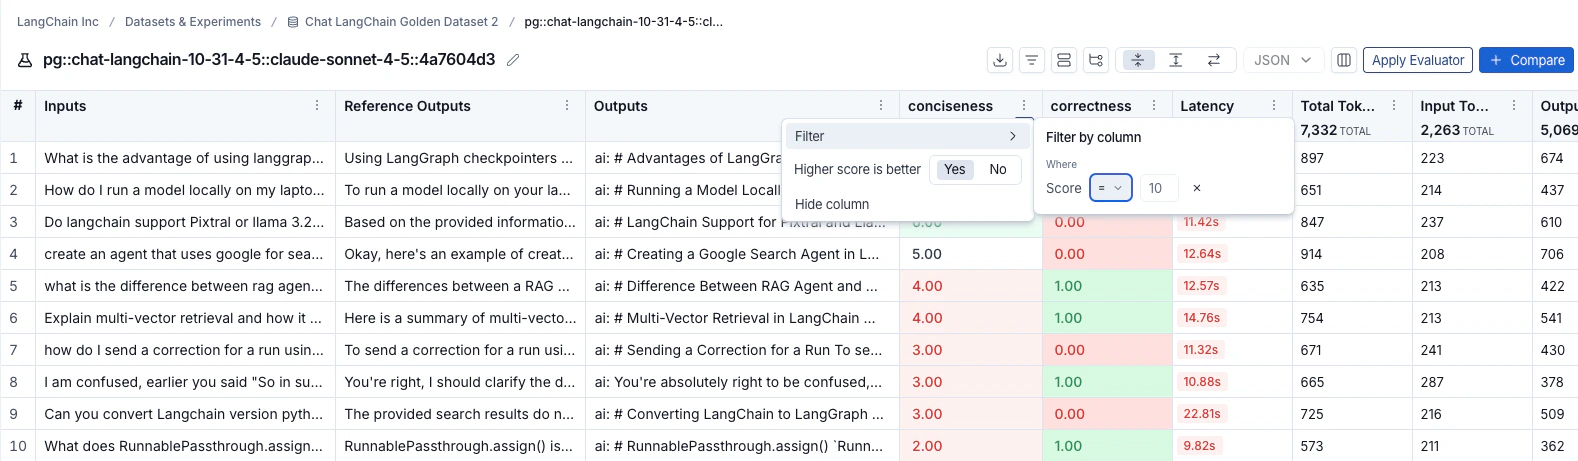
Table views
Select one of three table view icons at the top right of the experiment view:- Compact: Shows each run as a single row for quick score comparisons.
- Full: Shows the full output for each run.
- Diff: Shows the text difference between the reference output and the output for each run.
View the traces
Click any row in the experiment view to open the details panel, which shows the trace alongside feedback, input, output, and attributes for that run.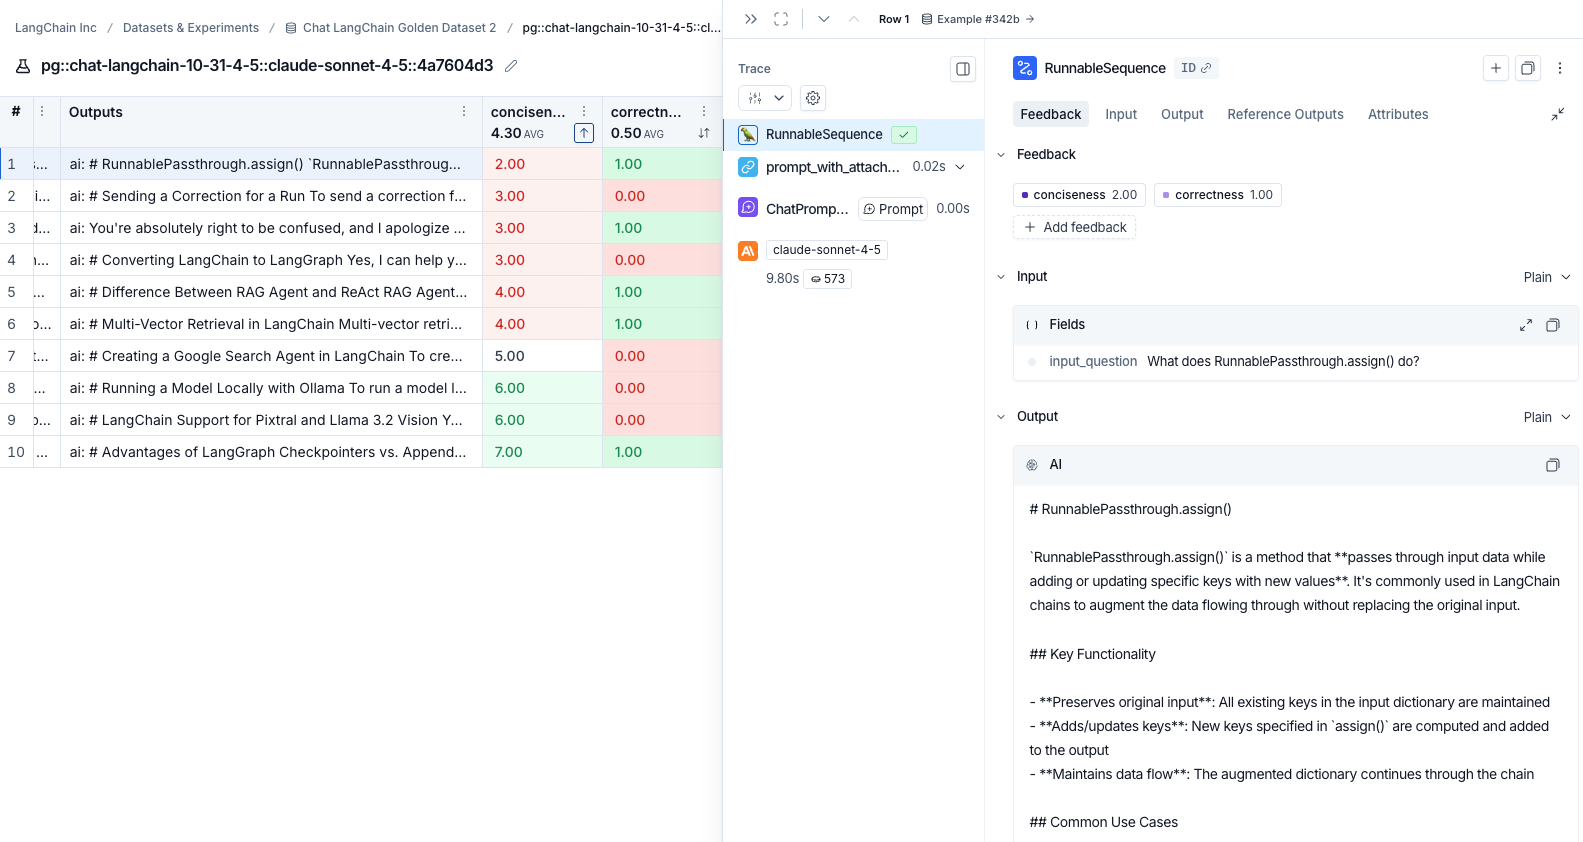
View evaluator runs
By hovering over the evaluator score, you can view additional details about that evaluator run. For LLM-as-a-judge evaluators, click the Source link to view the prompt used, or Evaluator trace to open the trace in a new browser tab. For experiments with repetitions, click the aggregate average score to view links to all individual runs.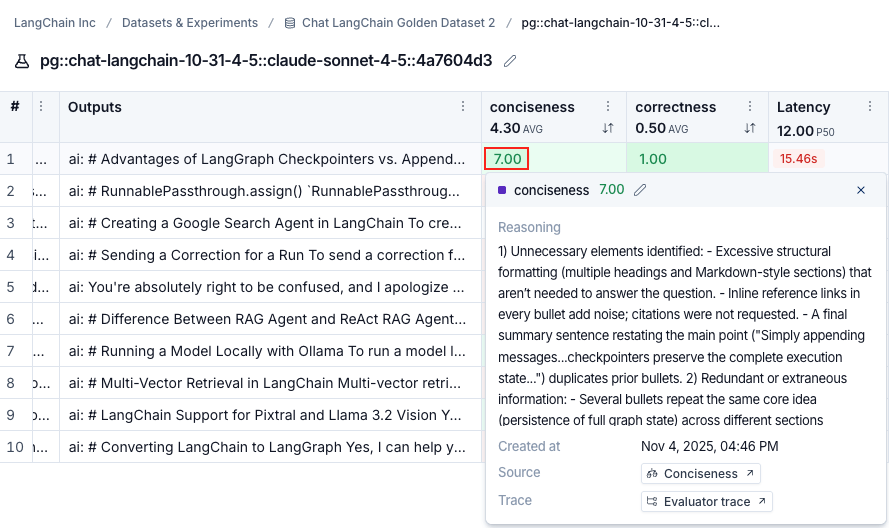
Track experiment progress
For experiments run from the Playground or through the SDK, a progress bar in the experiment header tracks completion in real time. The same progress appears in the Progress column of the experiments table. Progress reflects both run and evaluation status. Hover over the progress bar to view the number of runs completed and runs evaluated.Progress tracking for experiments run through the SDK requires:
- Python:
langsmith>=0.8.16 - TypeScript:
langsmith>=0.7.8
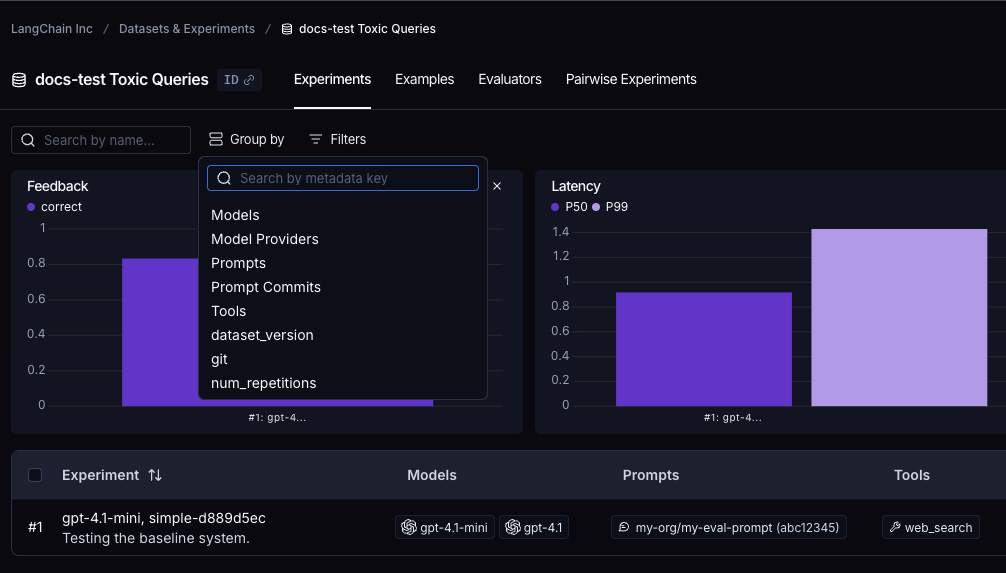
Group results by metadata
You can add metadata to examples to categorize and organize them. For example, if you’re evaluating factual accuracy on a question answering dataset, the metadata might include which subject area each question belongs to. Metadata can be added either via the UI or via the SDK. To analyze results by metadata, use the Group by icon at the top right of the experiment view and select your desired metadata key. This displays average feedback scores, latency, total tokens, and cost for each metadata group.You will only be able to group by example metadata on experiments created after February 20th, 2025. Any experiments before that date can still be grouped by metadata, but only if the metadata is on the experiment traces themselves.
Repetitions
If you’ve run your experiment with repetitions, click any row to open the details panel. The Repetition Summary shows a metrics table, all feedback scores, and lets you toggle through outputs or view individual repetitions with their traces.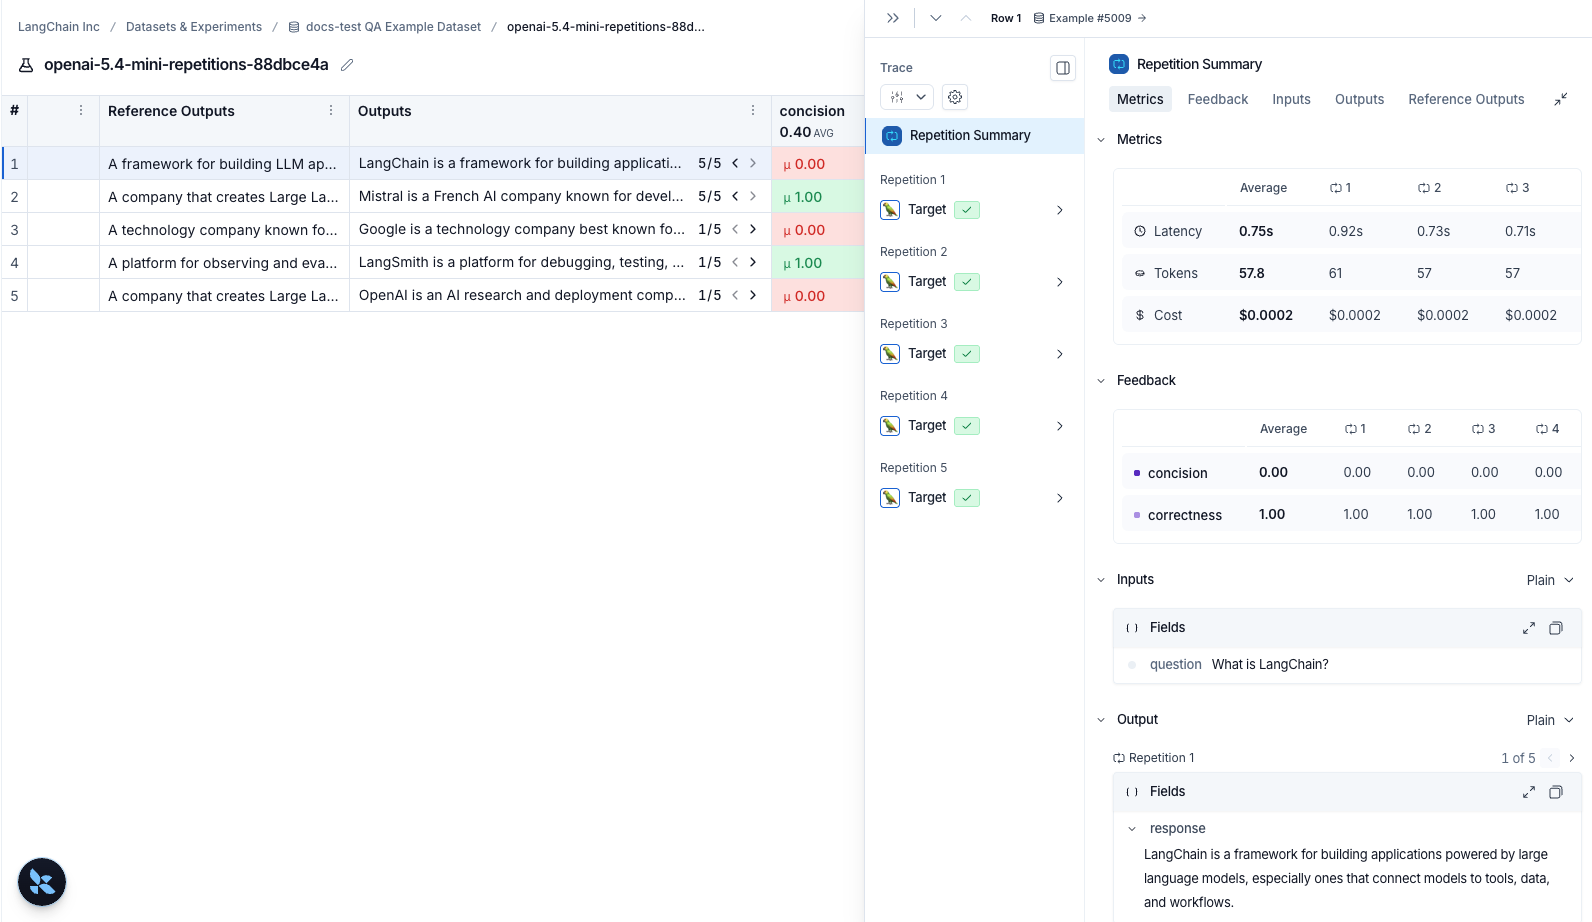
Compare to another experiment
In the top right of the experiment view, you can select another experiment to compare to. This will open up a comparison view, where you can see how the two experiments compare. To learn more about the comparison view, see how to compare experiment results.Set a baseline in the Experiments tab view
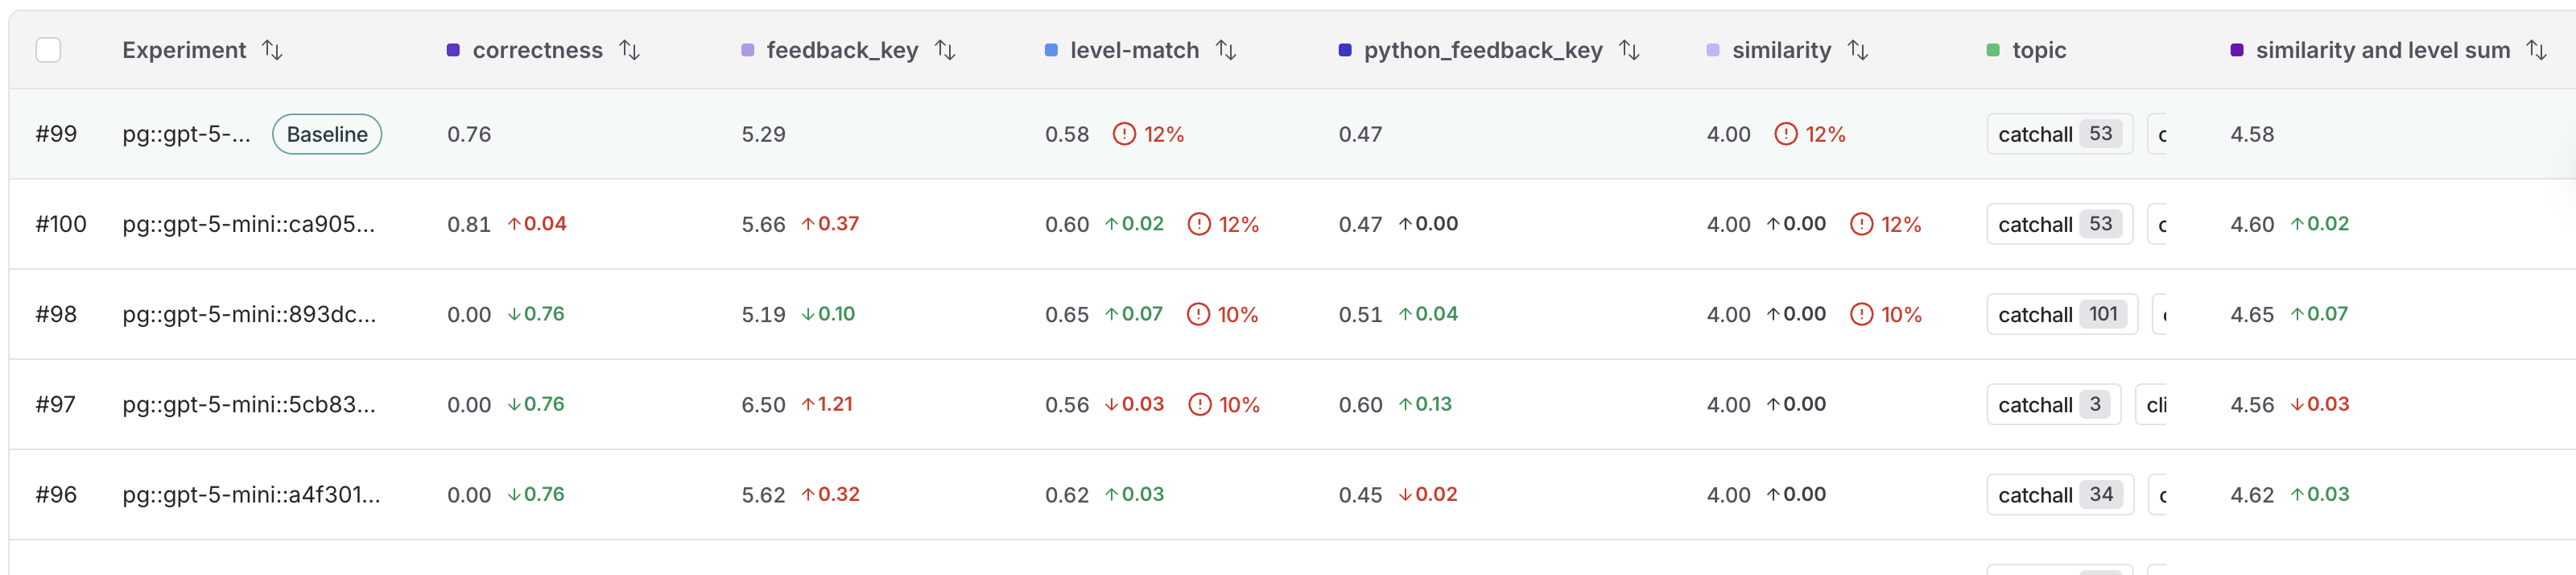
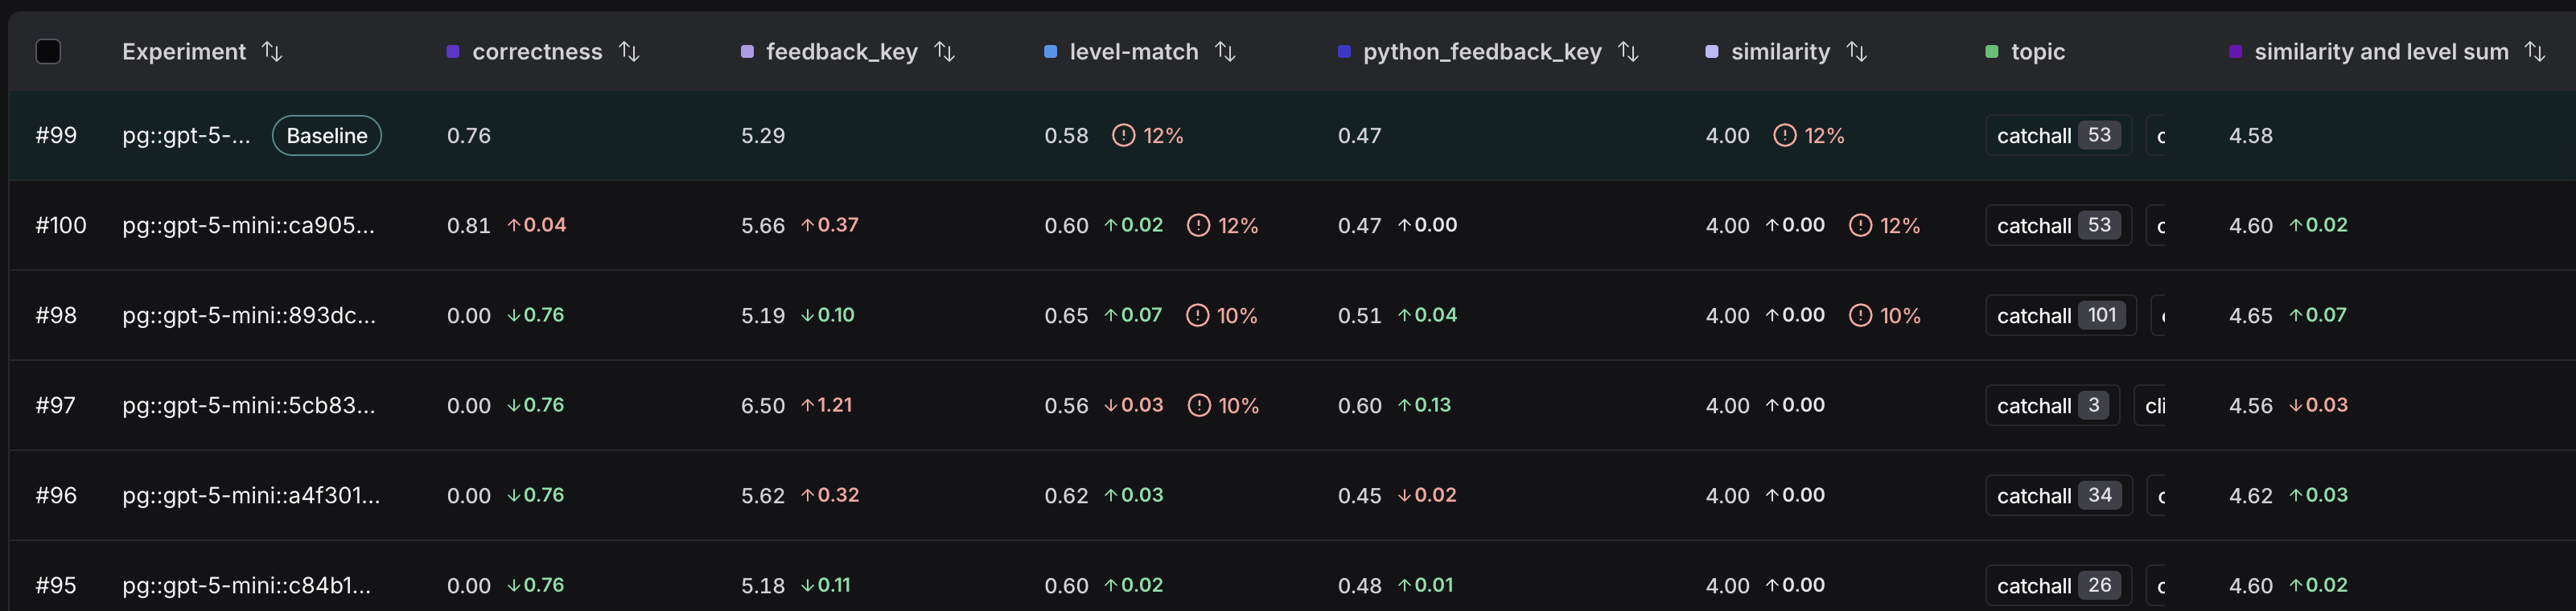
While you may run dozens of tests, you typically have a specific benchmark you are trying to outperform. Setting a baseline anchors your results against this reference point, which allows you to identify improvements or regressions in a crowded experiment list. By designating a baseline, you can:- Highlight a reference: Explicitly mark your best-performing run so it remains visible at the top of the Experiments tab view as you iterate.
- See instant diffs: View performance deltas across all experiments automatically, which means you don’t necessarily need to perform manual side-by-side selection.
- Accelerate assessment: Quickly determine if new iterations meet or exceed your current performance standards.
- In the LangSmith UI, navigate to the Datasets & Experiments option in the left menu.
- Select the dataset that you want to work with from the table.
- In the Experiments tab view, hover over an experiment row to display the Set baseline button on the right end of the row. Click to select your baseline experiment.
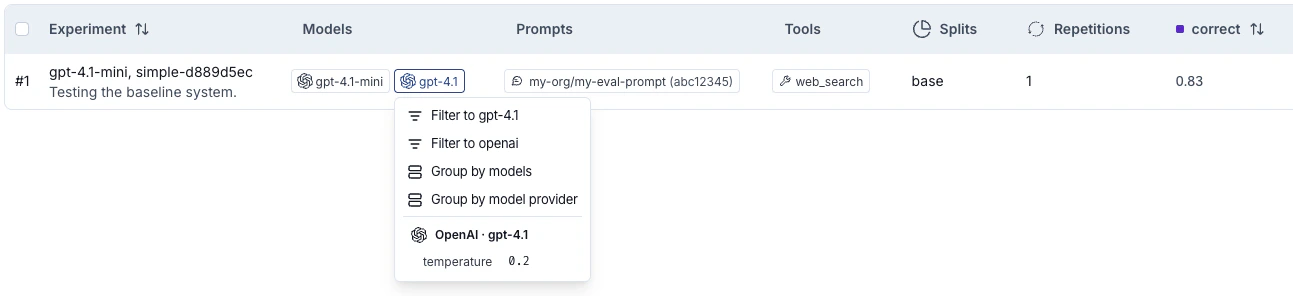
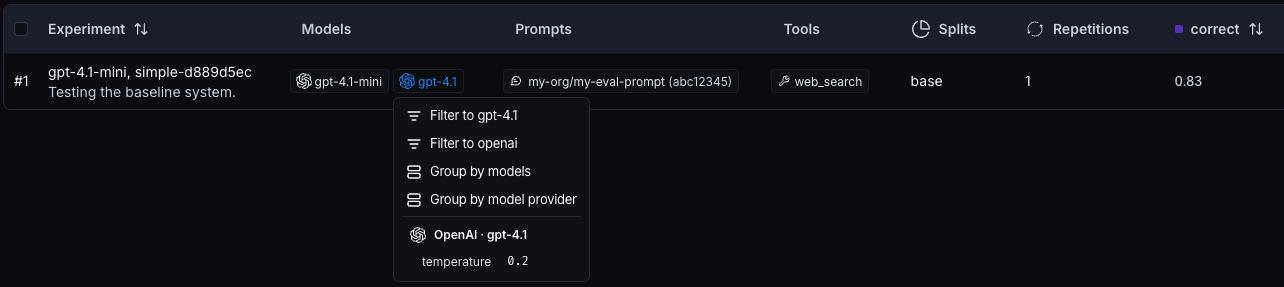
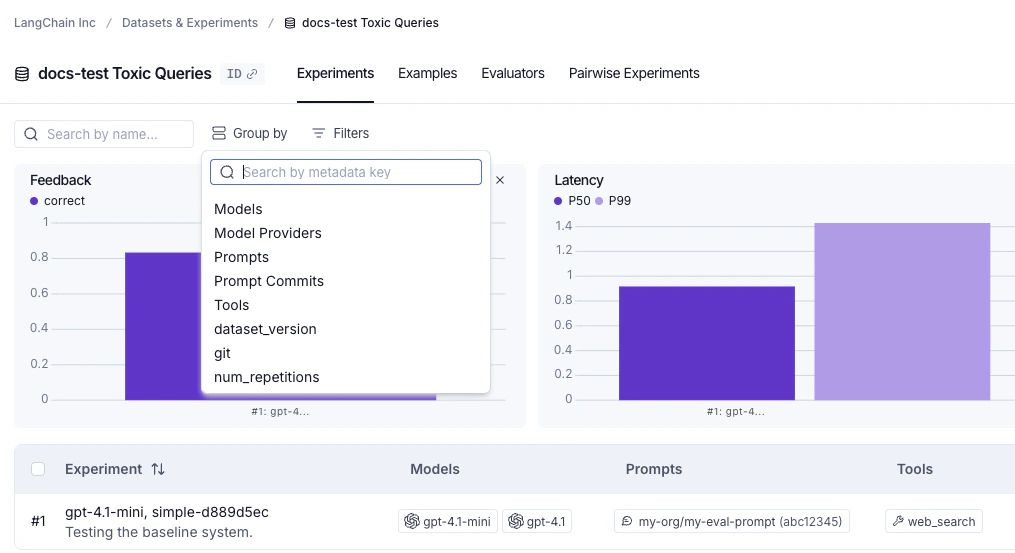
Filter and group by models, prompts, and tools in the Experiments tab view
The experiments table includes Models, Prompts, and Tools columns that show which models, prompts, and tools were used for each experiment, making it easier to understand what changed between runs at a glance. These columns are populated automatically when you run experiments from the Playground. When running experiments via the SDK, pass ametadata object with models, prompts, and tools keys to evaluate():
Download experiment results as a CSV
LangSmith lets you download experiment results as a CSV file for external analysis and sharing. Click the Download as CSV icon at the top right of the experiment view.There is a 5,000 row download limit for experiment results.
Rename an experiment
Experiment names must be unique per workspace.
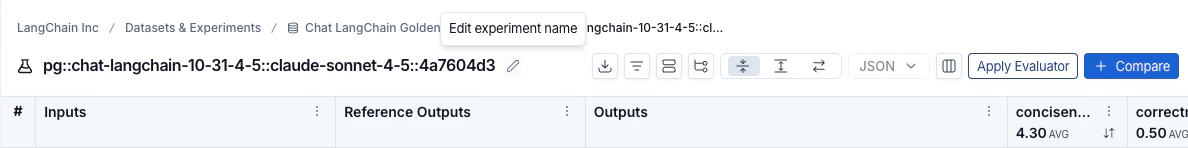
-
Experiment view: Rename an experiment by using the pencil icon beside the experiment name.
-
Playground: A default name with the format
pg::prompt-name::model::uuid(eg.pg::gpt-5.4-mini::897ee630) is automatically assigned. You can rename an experiment immediately after running it by editing its name in the Playground table header.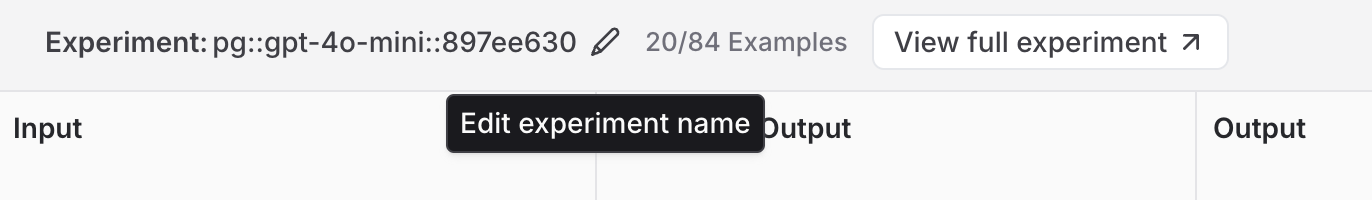
Connect these docs to Claude, VSCode, and more via MCP for real-time answers.