

Insights is available for LangSmith Plus and Enterprise plans.
Prerequisites
- A model configuration set up for Insights in your workspace.
- Permissions to create rules in LangSmith (required to generate new Insights Reports).
- Permissions to view tracing projects in LangSmith (required to view existing Insights Reports).
Generate your first Insights report
- UI
- SDK
- Navigate to Tracing Projects in the left-hand menu and select a tracing project.
- Click +New in the top right corner then New Insights Report to generate new insights over the project.
- Enter a name for your job.
- If you haven’t already, configure a model for Insights in your workspace settings.
- Answer the guided questions to focus your Insights Report on what you want to learn about your agent, then click Run job.
Generating insights over 1,000 threads typically costs $1.00-$2.00 with OpenAI models and $3.00-$4.00 with current Anthropic models. The cost scales with the number of threads sampled and the size of each thread.
Understand the results
Once your job has completed, you can navigate to the Insights tab where you’ll see a table of Insights Report. Each Report contains insights generated over a specific sample of traces from the tracing project.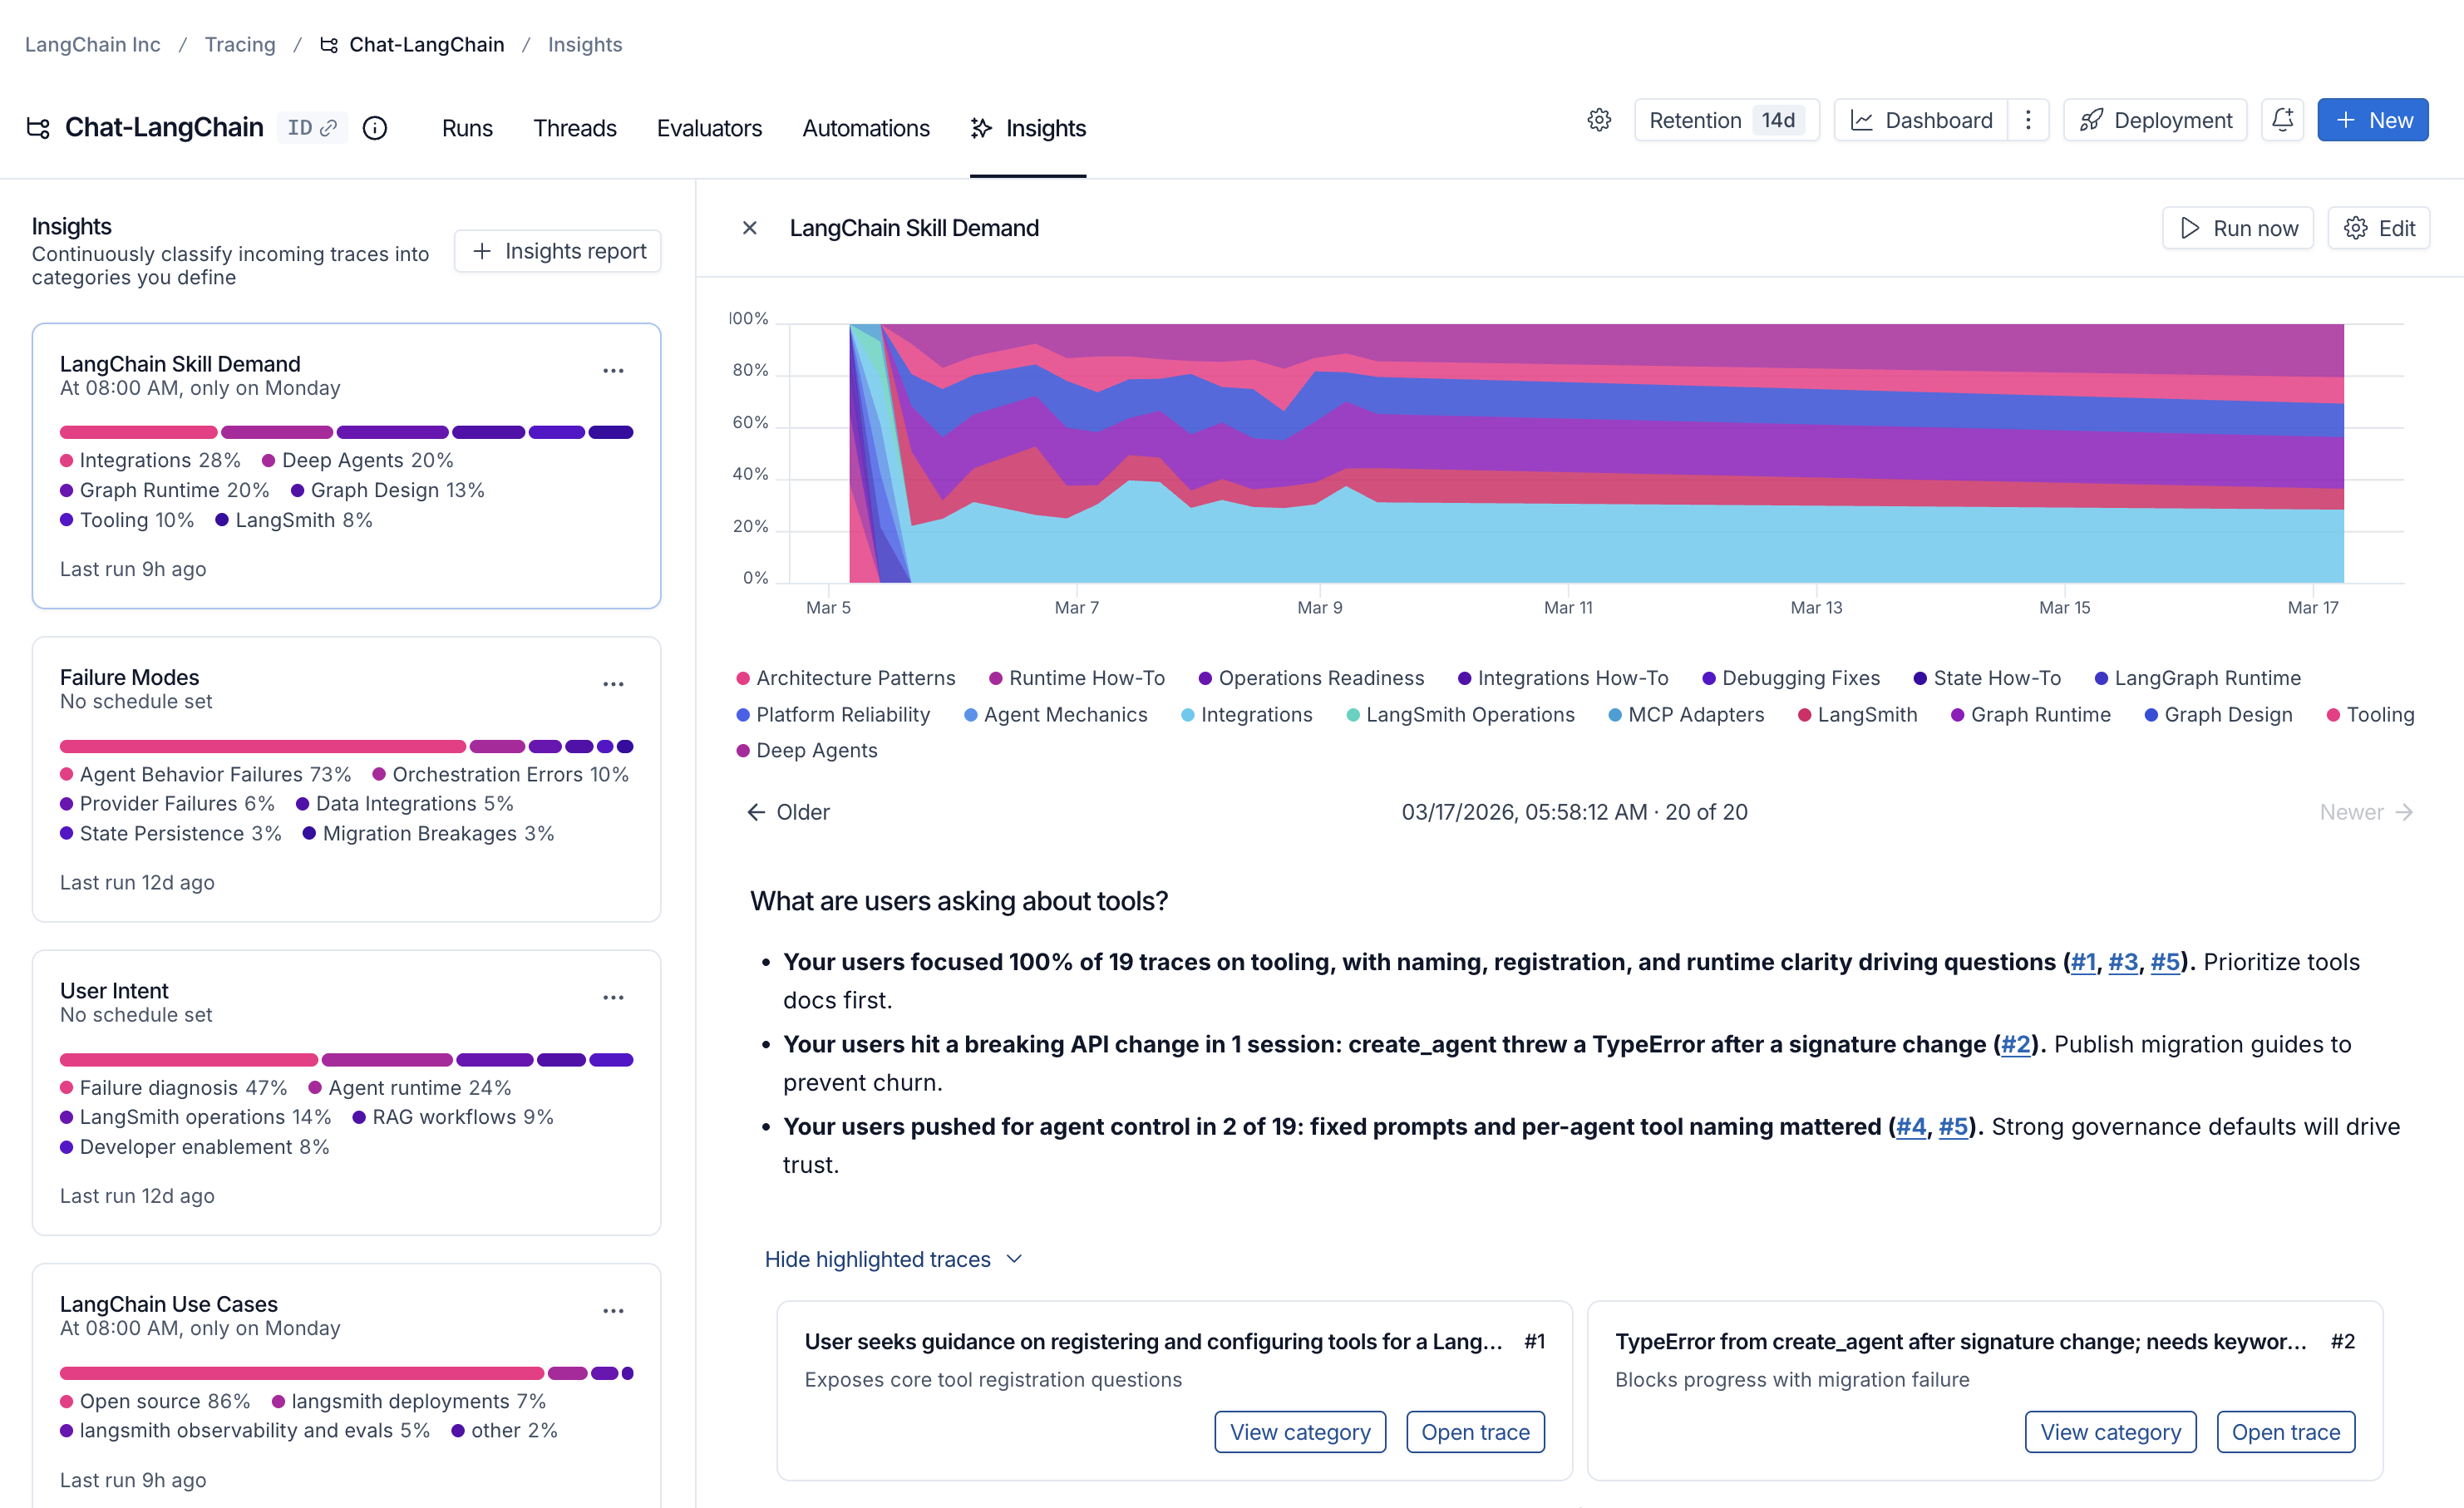
Executive summary
At the top of each report, you’ll find an executive summary that surfaces the most important patterns discovered in your traces. This includes:- Key findings with percentages showing how often each pattern appears.
- Clickable references (e.g., #1, #2, #3) to traces the agent identified as exceptionally relevant to your question.
Top-level categories
Your traces are automatically grouped into top-level categories that represent the broadest patterns in your data. The distribution bars show how frequently each pattern occurs, making it easy to spot behaviors that happen more or less than expected. Each category has a brief description and displays aggregated metrics over the traces it contains, including:- Typical trace stats (like error rates, latency, cost)
- Feedback scores from your evaluators
- Attributes extracted as part of the job
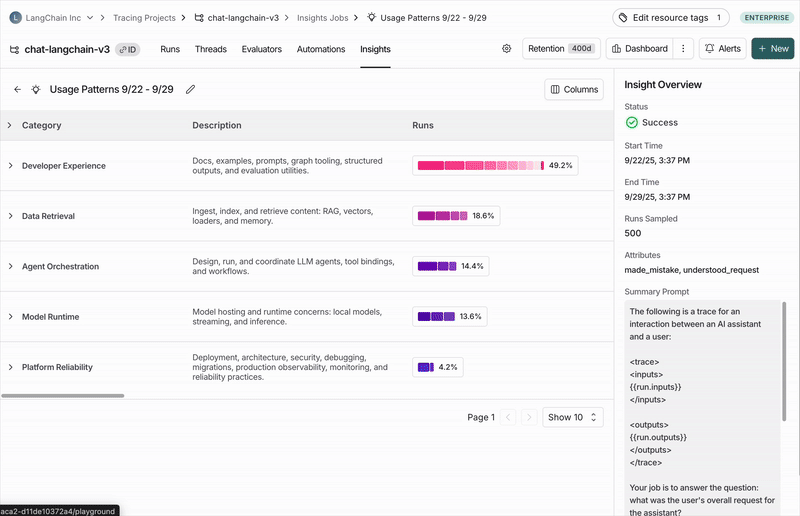
Subcategories
Clicking on any category shows a breakdown into subcategories, which gives you a more granular understanding of interaction patterns in that category of traces. In the Chat Langchain example, under Data & Retrieval there are subcategories like Vector Stores and Data Ingestion.Individual traces
You can view the traces assigned to each category or subcategory by clicking through to see the traces table. From there, you can click into any trace to see the full conversation details.Configure a job
You can create an Insights Report using the auto-generated flow or by configuring it manually.Autogenerating a config
- Open New Insights and make sure the Auto toggle is active.
- Answer the natural-language questions about your agent’s purpose, what you want to learn, and how traces are structured. Insights will translate your answers into a draft config (job name, summary prompt, attributes, and sampling defaults).
- Choose a provider, then click Generate config to preview or Run job to launch immediately.
Choose models
Insights uses two models:- Thinking model: performs the clustering step (more capable, higher cost).
- Summarization model: generates the per-trace summaries (faster, lower cost).
Manual configuration
Manual configuration gives you more control—for example, predefining categories you want your data grouped into or targeting traces that match specific feedback scores and filters.Select traces
- Sample size: The maximum number of traces to analyze (1,000 limit).
- Time range: Traces are sampled from this time range.
- Filters: Additional trace filters. As you adjust filters, you’ll see how many traces match your criteria.
Categories
By default, top-level categories are automatically generated bottom-up from the underlying traces. In some instances, you know specific categories you’re interested in upfront and want the job to bucket traces into those predefined categories. The Categories section of the config lets you do this by enumerating the names and descriptions of the top-level categories you want to be used. Subcategories are still auto-generated by the algorithm within the predefined top-level categories. When a job completes, the discovered top-level categories are automatically saved back to the config—but only if the config had no categories defined beforehand. This means subsequent scheduled runs will reuse those categories for consistency.Summary prompt
The first step of the job is to create a brief summary of every trace. These summaries are then categorized. Extracting the right information in the summary is essential for getting useful categories. You can edit the prompt used to generate these summaries. The two things to think about when editing the prompt are:- Summarization instructions: Any information that isn’t in the trace summary won’t affect the categories that get generated, so make sure to provide clear instructions on what information is important to extract from each trace.
- Trace content: Use mustache formatting to specify which parts of each trace are passed to the summarizer. Large traces with lots of inputs and outputs can be expensive and noisy. Reducing the prompt to only include the most relevant parts of the trace can improve your results.
| Variable | Description | Example |
|---|---|---|
run.inputs | Inputs of the most recent root run | {{run.inputs}} |
run.outputs | Outputs of the most recent root run | {{run.outputs}} |
run.error | Error string, if the run failed | {{run.error}} |
run.feedback | All feedback scores as a JSON blob | {{run.feedback}} |
run.feedback.<key> | A specific feedback score by key | {{run.feedback.correctness}} |
all_thread_messages | Full message history for the thread (only available for projects with threads) | {{all_thread_messages}} |
{{run.inputs.foo.bar}} includes only the bar field within foo in the last run’s inputs.
For projects with threads, Insights analyzes full conversations. Only the most recent root run from each thread is used for
run.* variables. Use all_thread_messages to access the complete conversation history.Attributes
Along with a summary, you can define additional string, numerical, and boolean attributes to be extracted from each trace. These attributes will influence the categorization step—traces with similar attribute values will tend to be categorized together. You can also see aggregations of these attributes per category. As an example, you might want to extract the attributeuser_satisfied: boolean from each trace to steer the algorithm towards categories that split up positive and negative user experiences, and to see the average user satisfaction per category.
Filter attributes
You can use thefilter_by parameter on boolean attributes to pre-filter traces before generating insights. When enabled, only traces where the attribute evaluates to true are included in the analysis.
This is useful when you want to focus your Insights Report on a specific subset of traces. For example, only analyzing errors, only examining English-language conversations, or only including traces that meet certain quality criteria.
How it works:
- Add
"filter_by": trueto any boolean attribute when creating a config for Insights. - The LLM evaluates each trace against the attribute description during summarization.
- Traces where the attribute is
falseor missing are excluded before insights are generated.
Schedule Insights Reports
Schedule Insights reports to run automatically on a recurring basis. When creating or editing a configuration, use the Schedule section to choose:- Daily: Runs every day at 8:00 UTC.
- Weekly on Monday: Runs every Monday at 8:00 UTC.
- Custom: Enter your own cron expression (in UTC).
Save your config
You can optionally save configs for future reuse using the Save as button. This is especially useful if you want to compare Insights Reports over time to identify changes in user and agent behavior. Select from previously saved configs in the dropdown in the top-left corner of the pane when creating a new Insights Report.Connect these docs to Claude, VSCode, and more via MCP for real-time answers.